TASK-AUTOMATE
PROJECT EXAMPLES
Below examples provide some insights into the type of automation workflows provided by Task-Automate. To learn more please contact us for a demo.
BASIC AUTOMATION EXAMPLES
AUTOMATED FINANCIAL REPORT
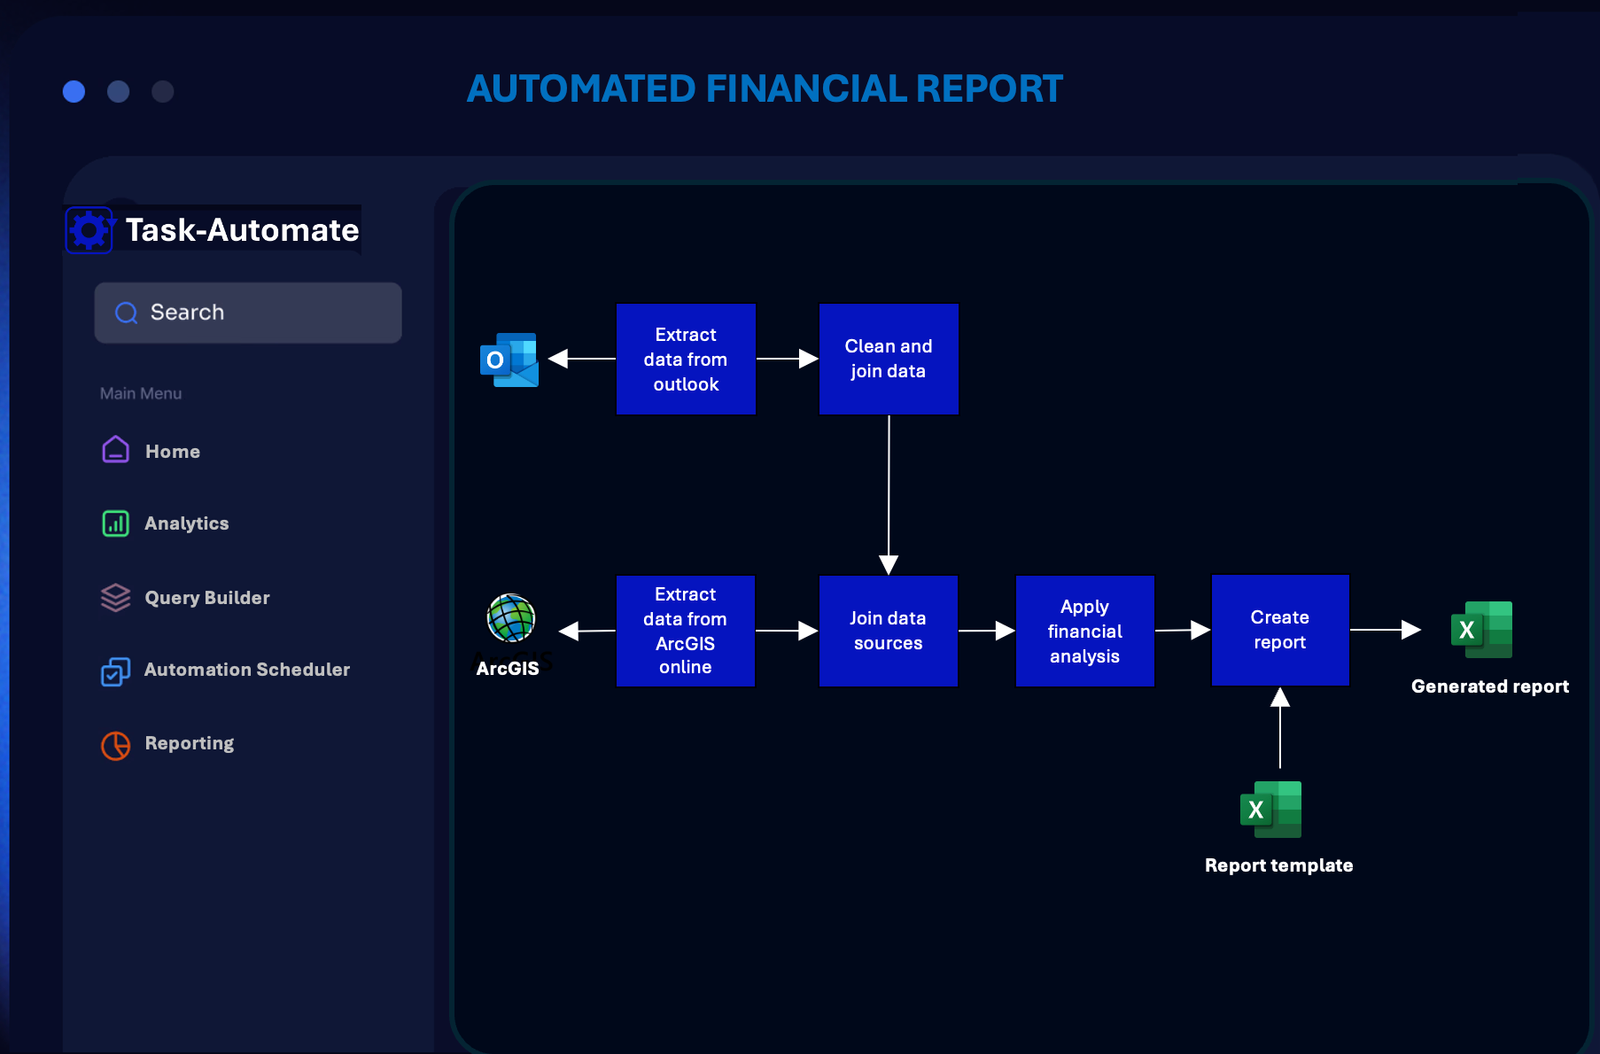
This automation workflow example automatically builds financial reports for a customer based on input data from Outlook and ArcGIS online, placing the finalised financial report in Sharepoint. The automation leverages Outlook and ArcGIS APIs to automatically collect data, each data source is cleaned and preprocessed before performing analysis. Analysis engine cross-references and processes the data, building the required financial report based on a template. The automation frequency is set by the creator (e.g. daily/weekly cycle).
ENUM TO VALUE MAPPING
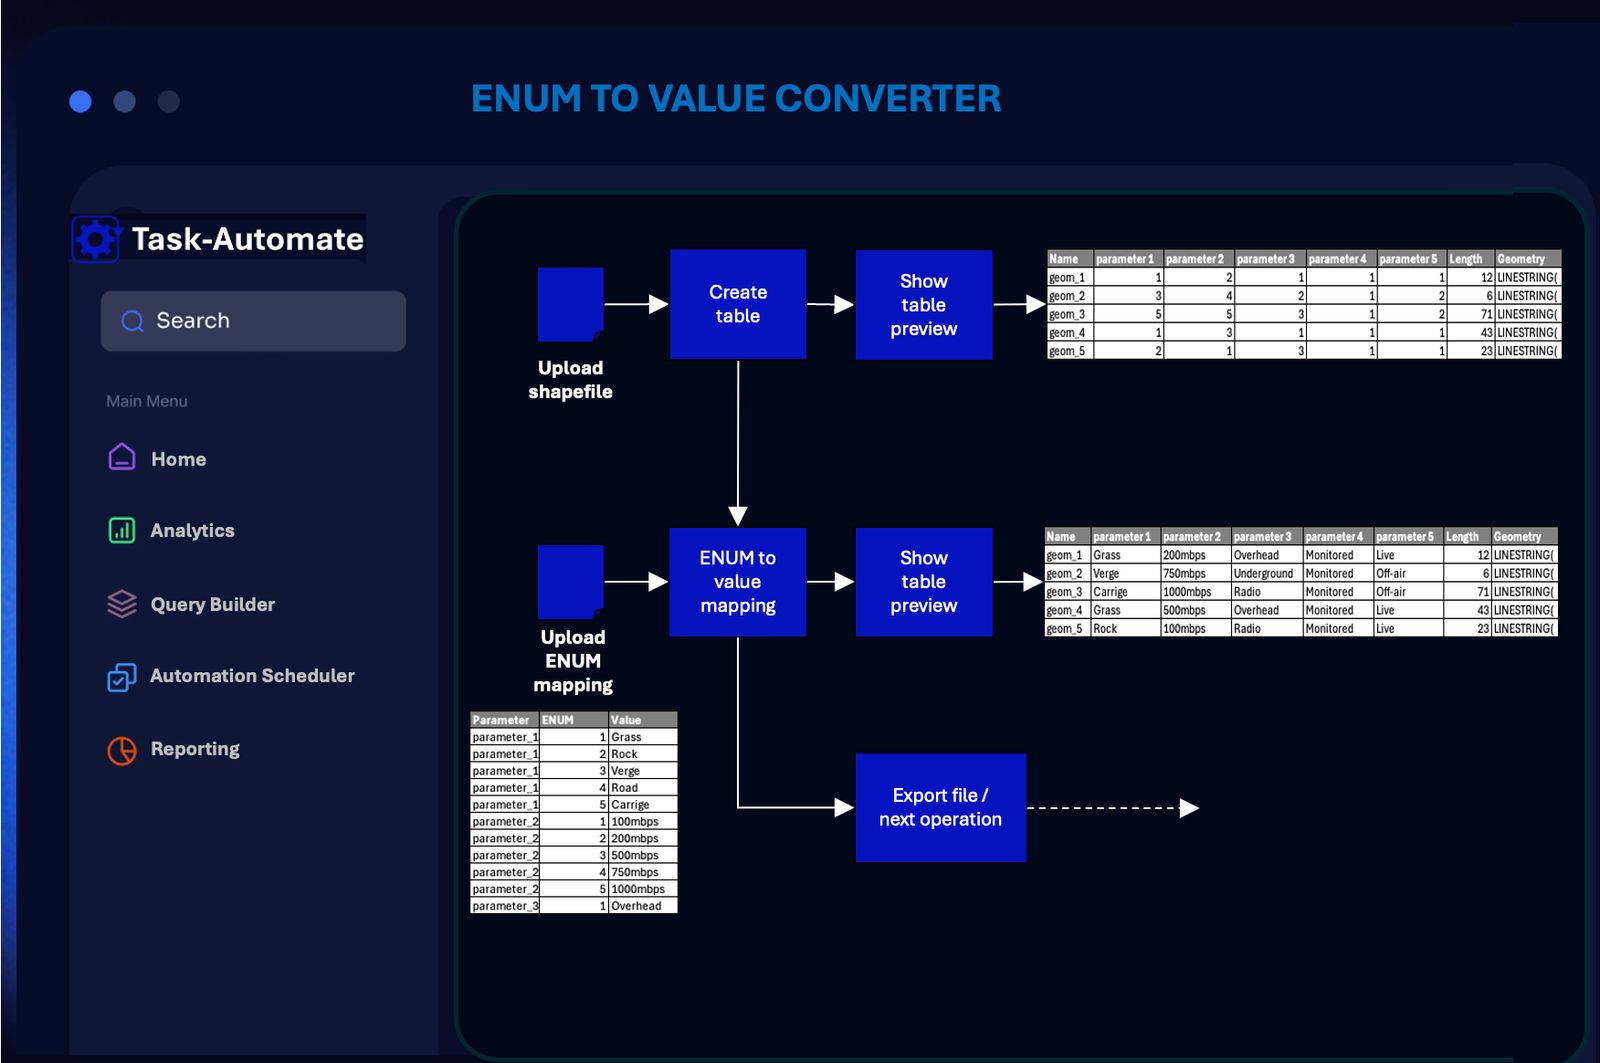
ENUMs are used to improve data efficiency in many tools such as ArcGIS and QGIS. Using ENUMS does not impose any issues within the tools themselves but can cause issues outside of the base tool. Fore instance a user may want to interrogate a QGIS file and cross reference it to an excel or CSV. This can be a cumbersome process even if the user has all of the required tools installed. With our SaaS offering the user can select the required file and ENUM mapping file , allowing the pre-defined module to do the ENUM enrichment with minimal effort.
RADIO NETWORK PREDICTION
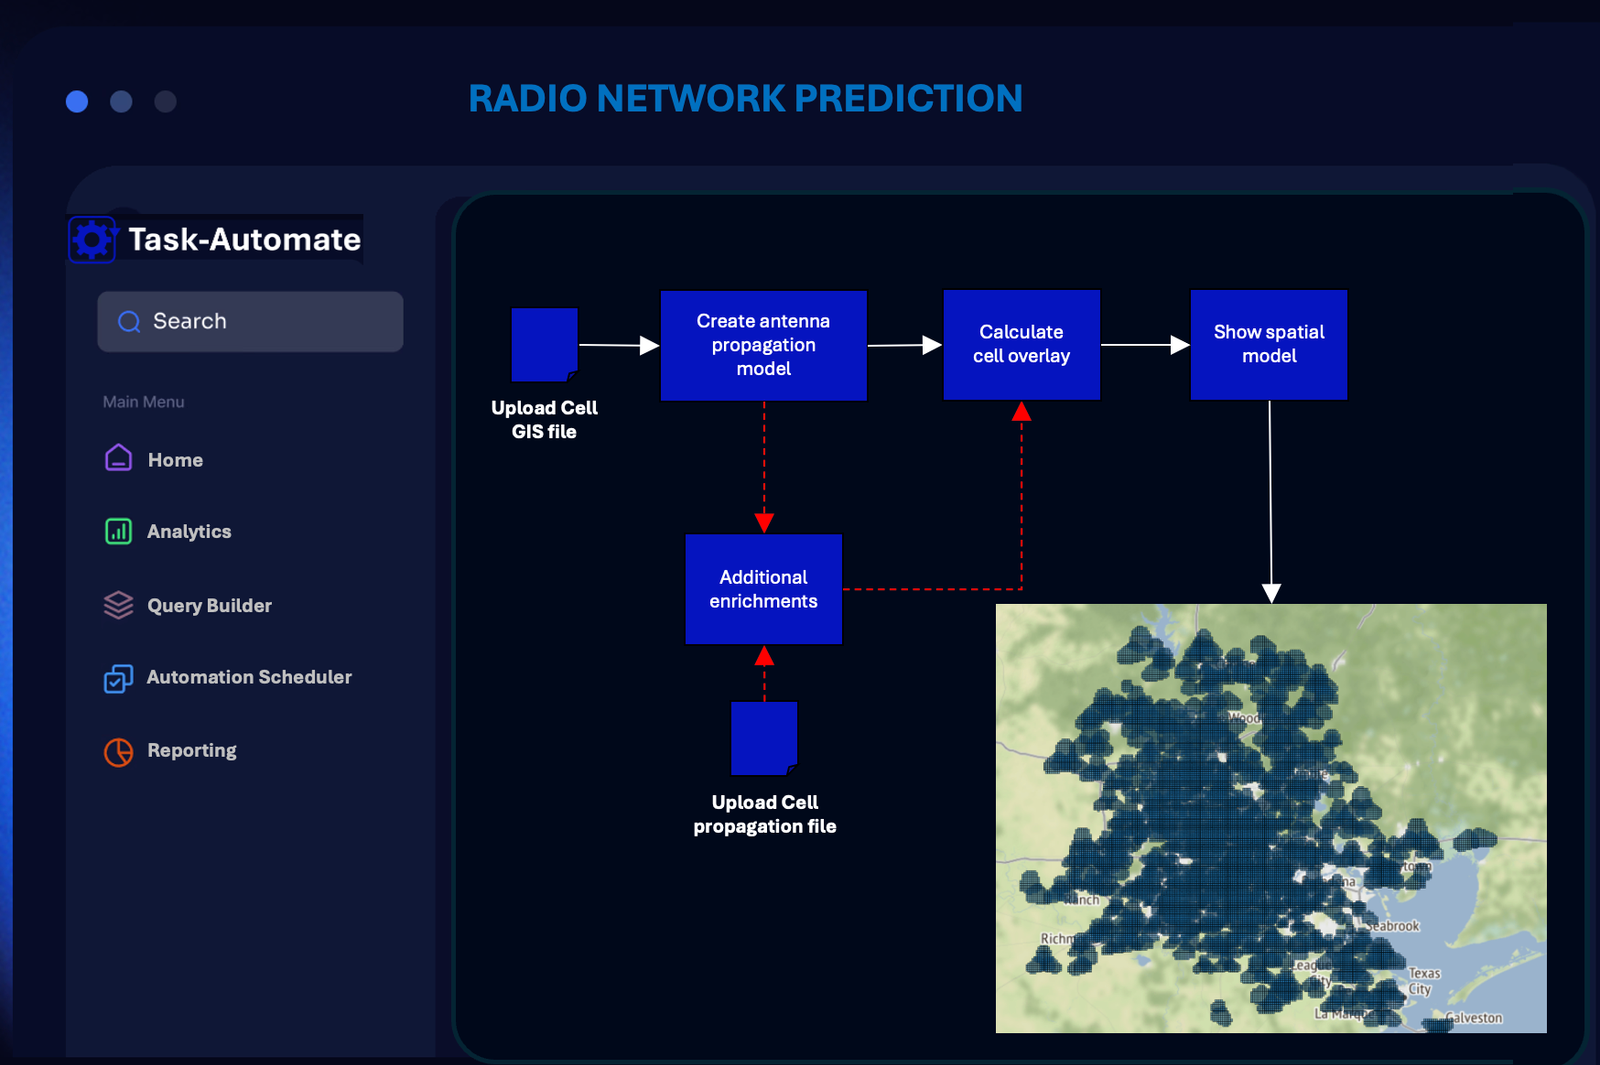
Predicting Radio Access Network (RAN) coverage and cell overlay from minimal data sets is a fundamental but often overlooked requirement to plan and optimise RAN networks. With as little information as site location, antenna direction, horizontal beam-width and tilt a model can be built to provide insights. Accuracy can be improved by adding additional data sources such as propagation delay, crowd source, and RAN trace data. We strive to build data models agnostic to the input data with only model accuracy being the driver of additional data integration.
INTERMEDIATE AUTOMATION EXAMPLES
INFRASTRUCTURE ENDPOINT COST
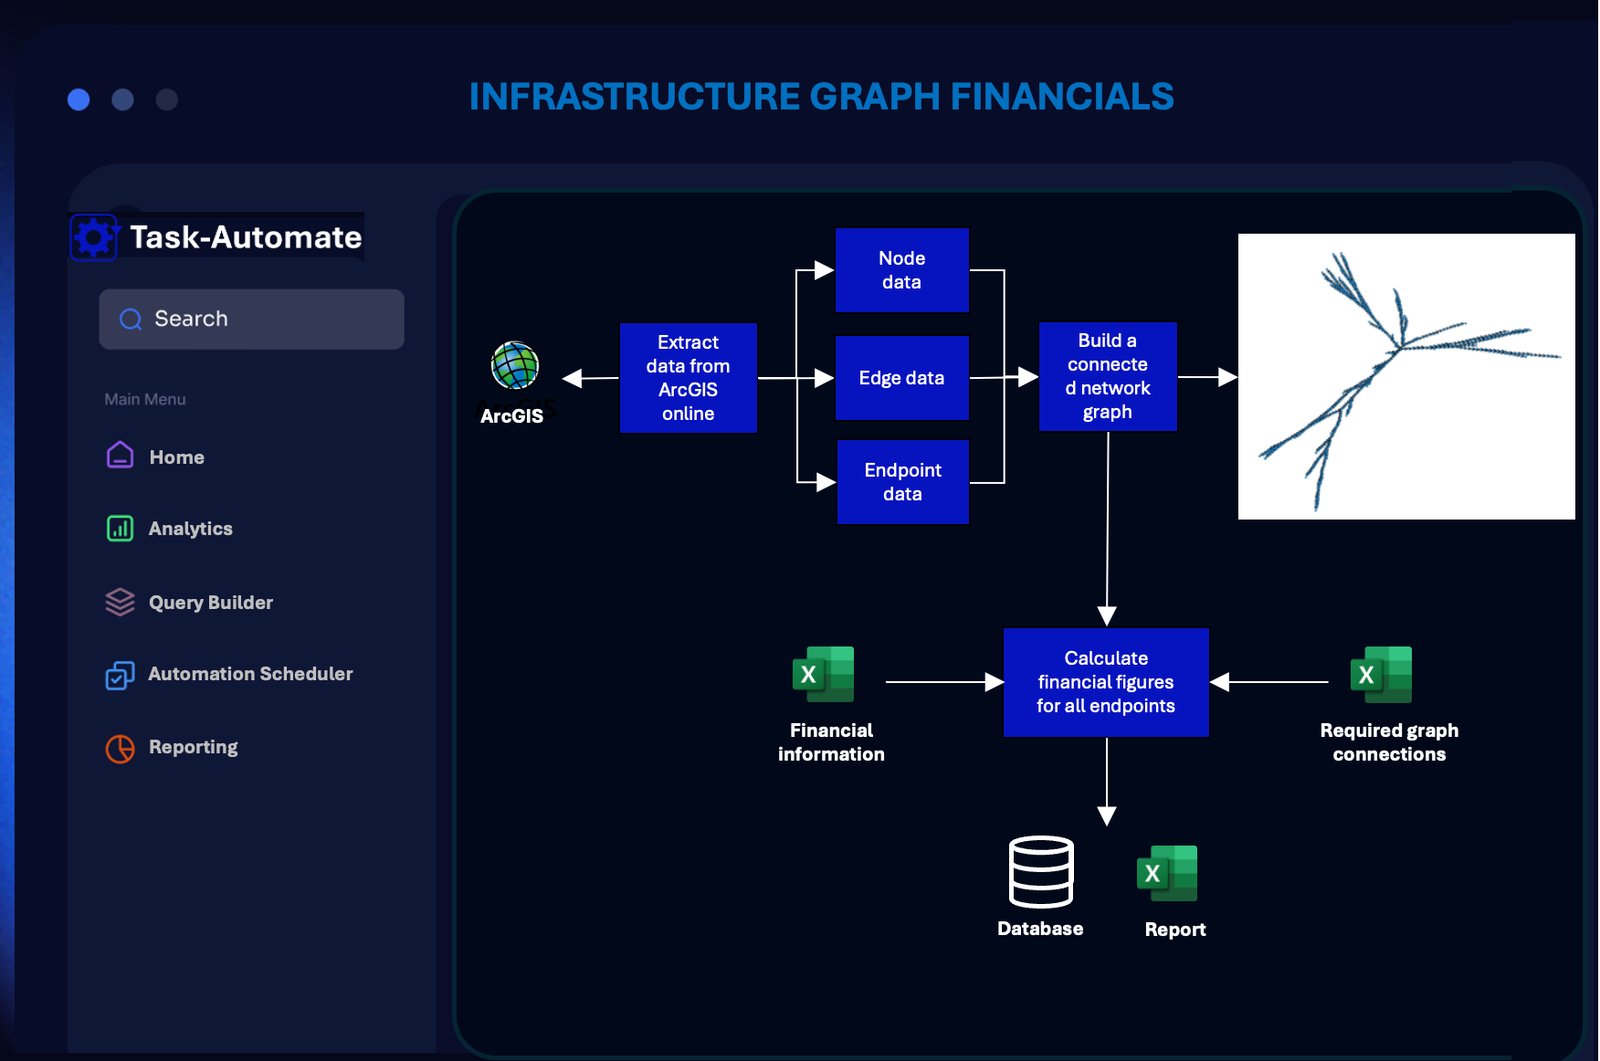
Understanding how a network is constructed from it’s source to endpoints is crucial. In this example we look at the costing implications on a fibre network in relation to network expansion and contraction projects.
Generating a network graph to accurately determine the price of all endpoints within the network allows the engineering and financial teams to make informed decisions on the networks evolution, balancing the expansion of services and the estimated return on investment.
NETWORK ISSUE DETECTION
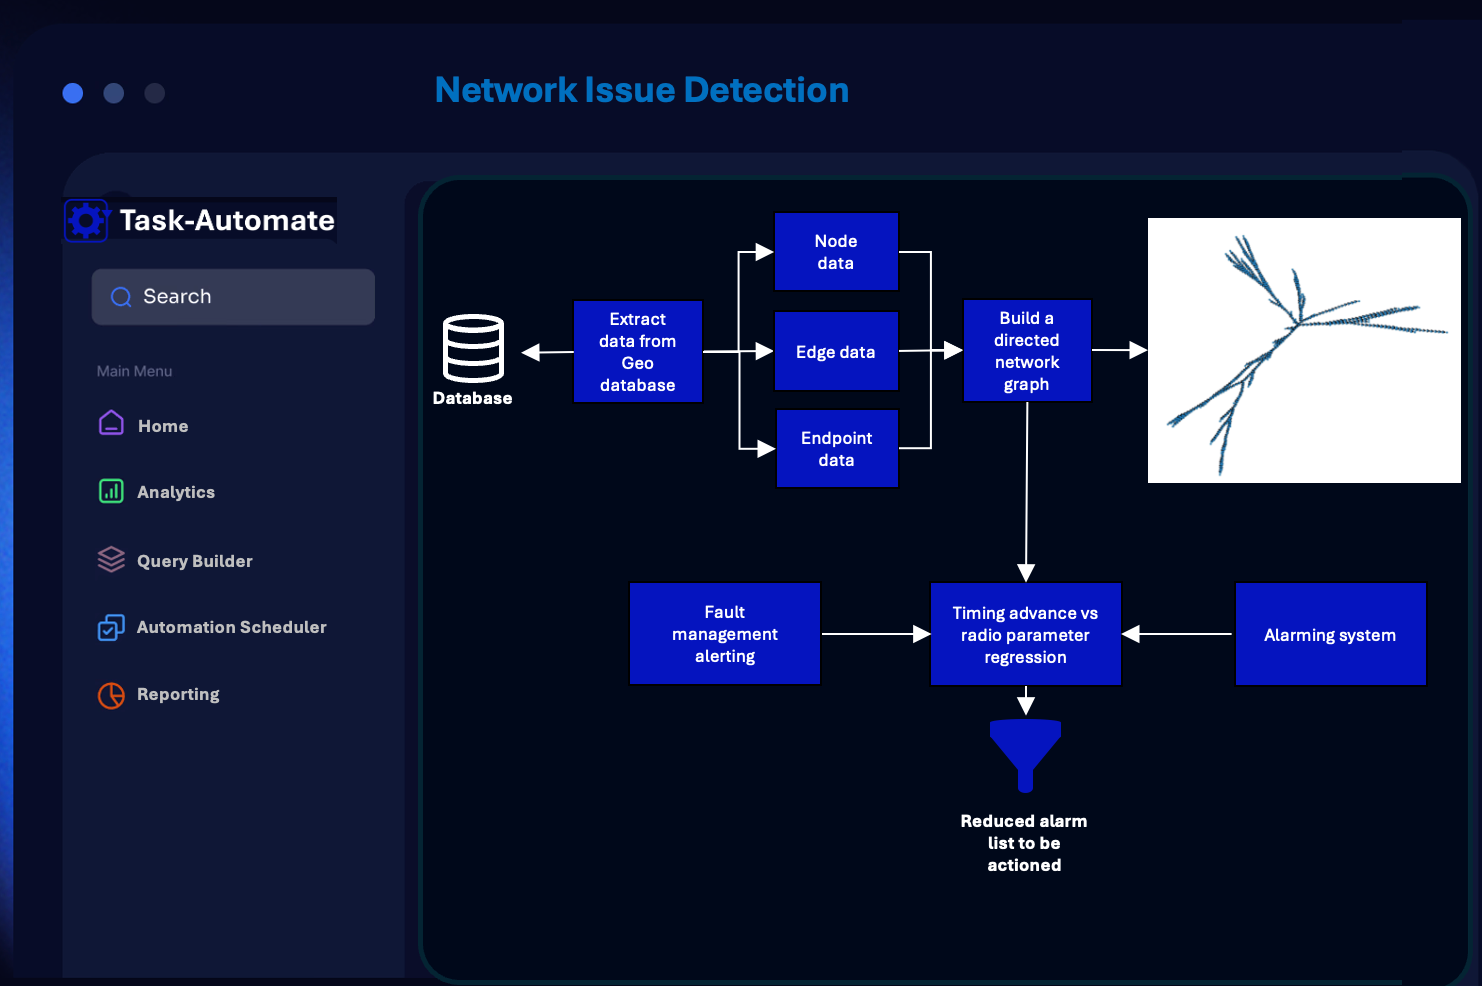
Understanding how a network is constructed from it’s source to endpoints is crucial. In this example a network graph is generated to determine where faults occur in a telecommunications transmission network. Using network configuration data to construct a directed network graph and a lightweight performance dataset, deep insights into both ongoing performance bottlenecks and faults can be produced at minimal costs. The automation process can be enhanced by feeding the data to a Self Optimising Network (SON) to load balance traffic as required.
RADIO PLANNING OPTIMISATION
Grid data sources are a fundamental building block for Radio Access Networks. Optimisation teams need to understand the geographical spread of issues such as poor coverage and throughput, or elevated drop call rates.
Here we explore the optimisation algorithms driven by grid data to enhance the experience and performance of the network subscribers. The number of use cases that fall into this category are fast and therefore a subset of algorithms will be explored to provide an understanding of what is possible in this space.
ADVANCED AUTOMATION EXAMPLES
DESIGN COMARISION
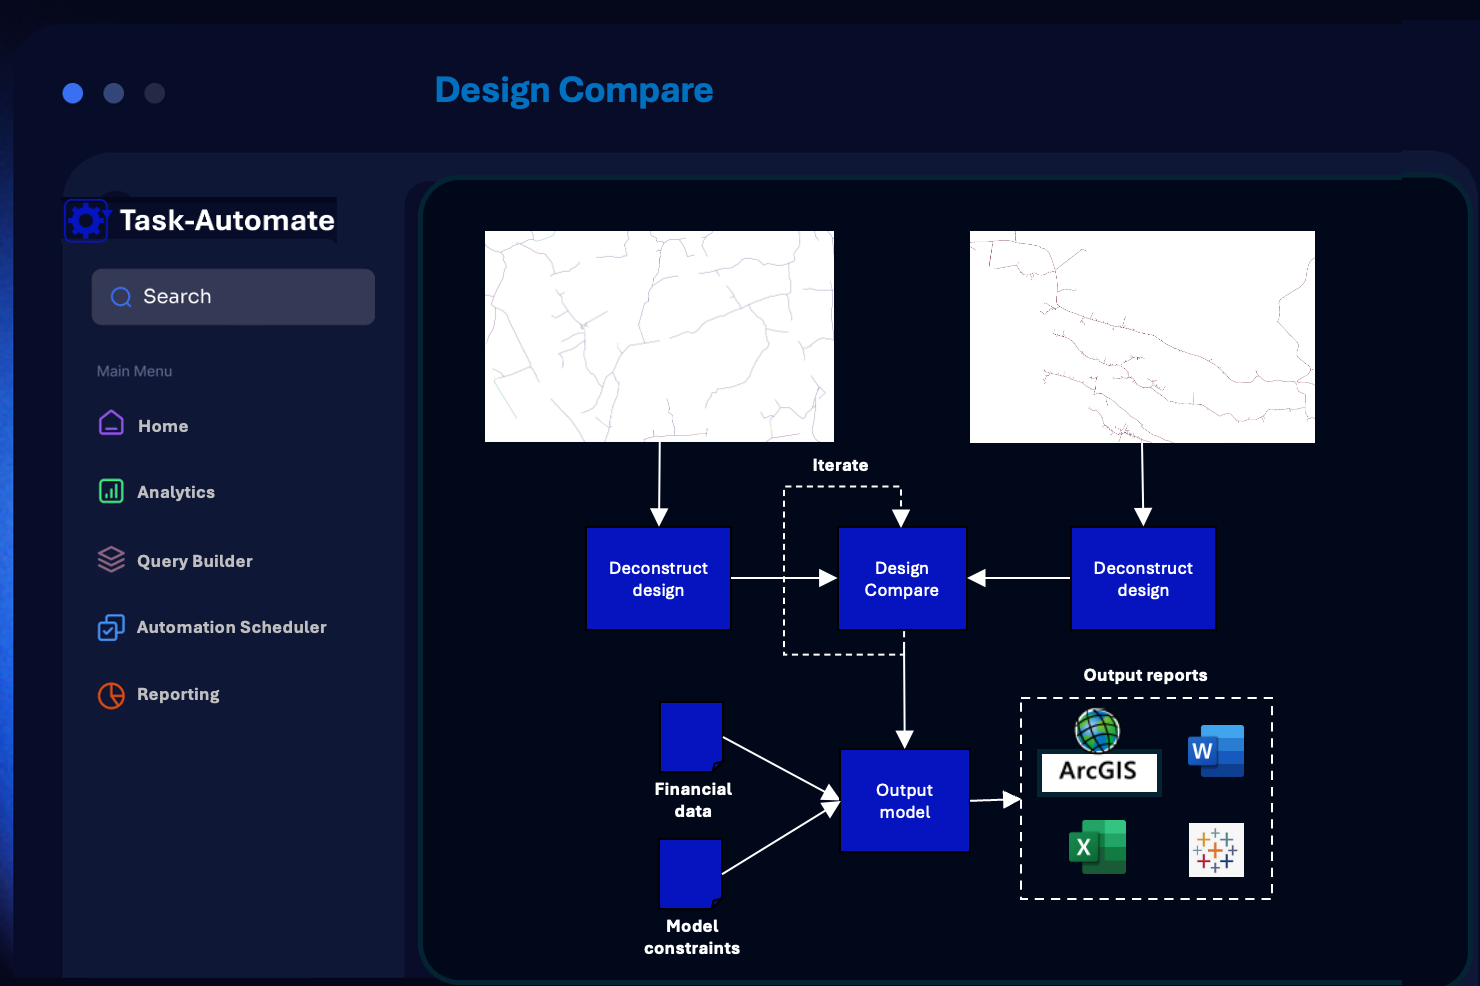
Comparing geographical designs with different geographical positioning is an advanced geospatial topic. In industry this is a task which usually relies on manual analysis by a skilled GIS engineer. It is time-consuming, error prone and delays downstream processes.
We provide a fully automated solution, requiring only a small set of thresholds and parameters to ensure the analysis conforms with requirements. The automated results are fast, accurate, and remove human discrepancies from the process.
PROBABILISTIC DATA MODELS
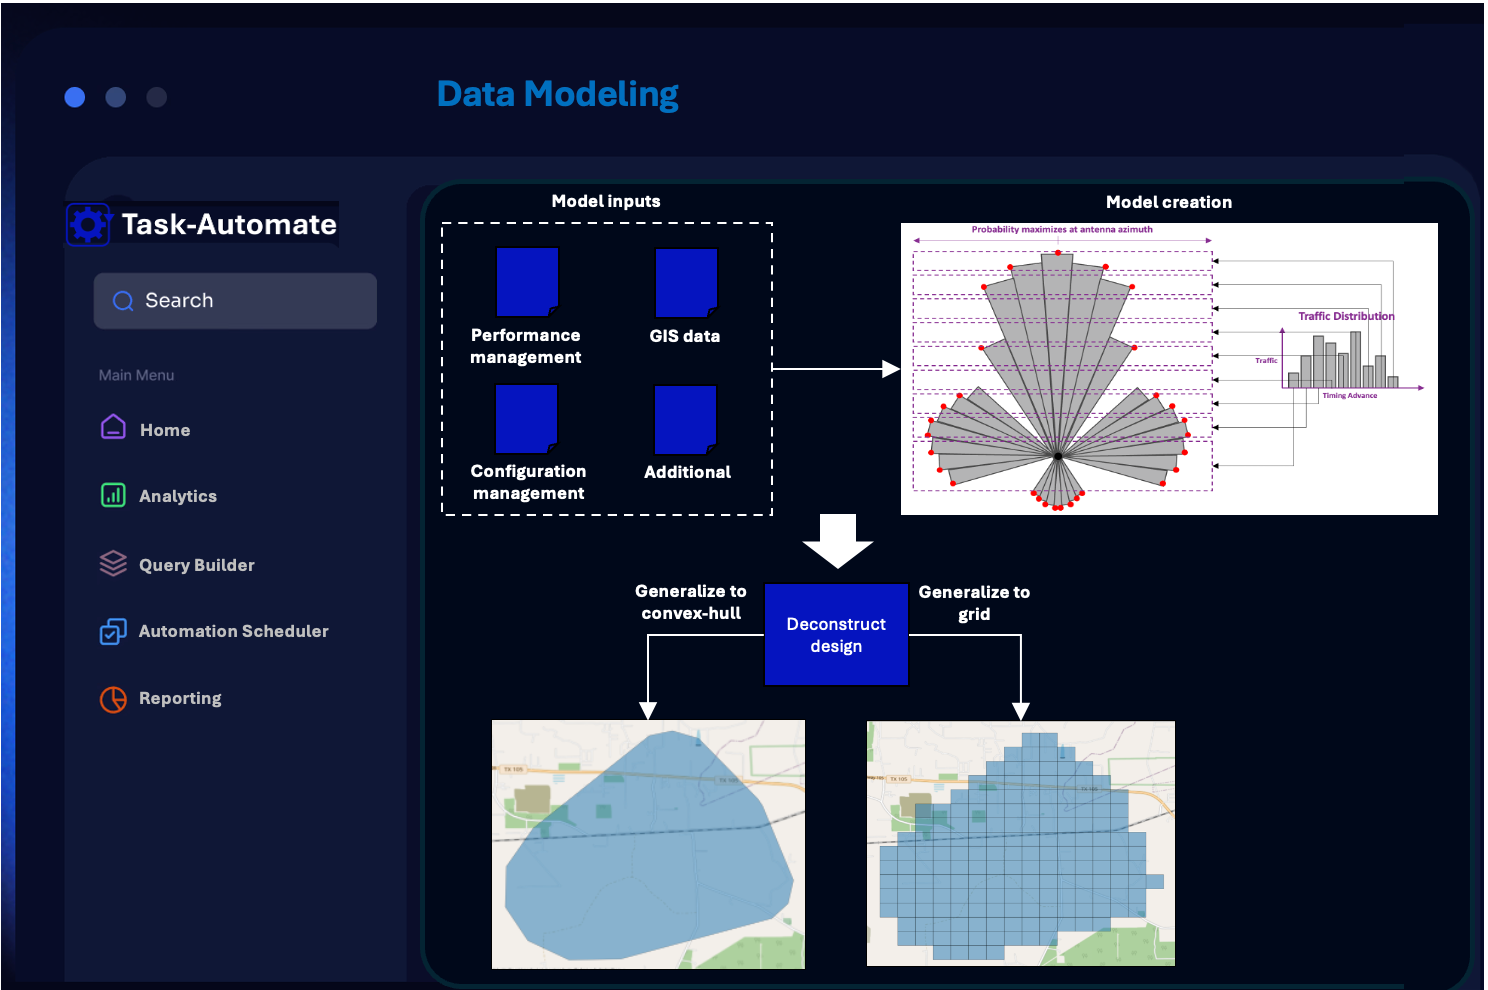
Data modelling is a crucial process in data pipelines, allowing companies to extract value and meaning from their data. Modelling entails a level of probability depending on the required insights and data sources available. Here we explore a use case modelling Radio Access Network (RAN) coverage and quality based on a limited data set.
In real world applications , having the ability to model data accurately is crucial, enabling downstream processes to use the data with confidence.
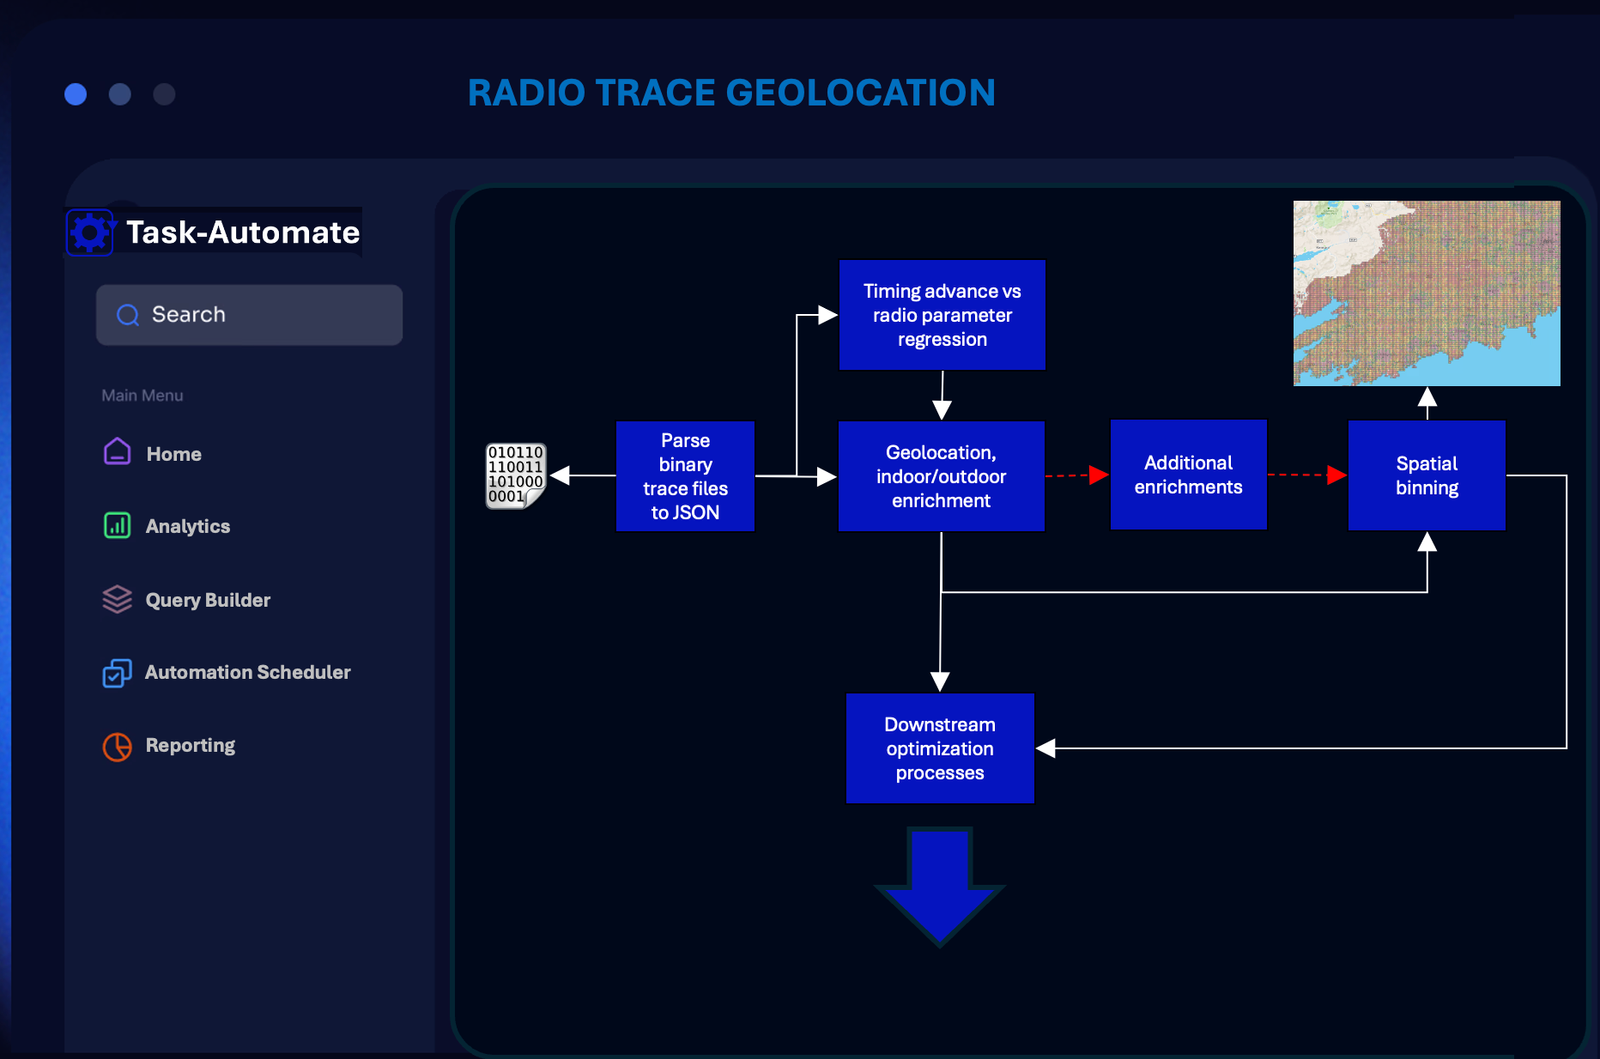
GEOLOCATION OF RADIO DATA
Geolocation of Radio Access Network (RAN) trace data is an advanced automation workflow requiring a number of automation tasks including, data parsing (binary to JSON), location enrichment (machine learning + geo-positioning), and data aggregation (spatial bins, transport infrastructure locations, etc.). Data aggregations can be used downstream by internal tools or to feed further automation workflows in the network planning and optimisation domains. Custom visualisation dashboards can be provided via cloud platforms (e.g. Tableaucloud).
Talk to us
Have any questions? We are always open to talk about your business, new projects, creative opportunities and how we can help you.