TASK-AUTOMATE
WHAT WE DO
At Task-Automate we strive to remove manual, labour intensive tasks through automation. The goal of automation is not to replace humans but rather to remove mundane tasks allowing employees to concentrate on value added tasks which require human ingenuity. Automation activities range in complexity from simple data parsing and manipulation assistants, to large scale AI driven automation workflows such as Radio Access Network (RAN) planning and optimisation. Examples of automation workflows are given below ranging in complexity and industry.
AUTOMATION EXAMPLES
AUTOMATED FINANCIAL REPORT
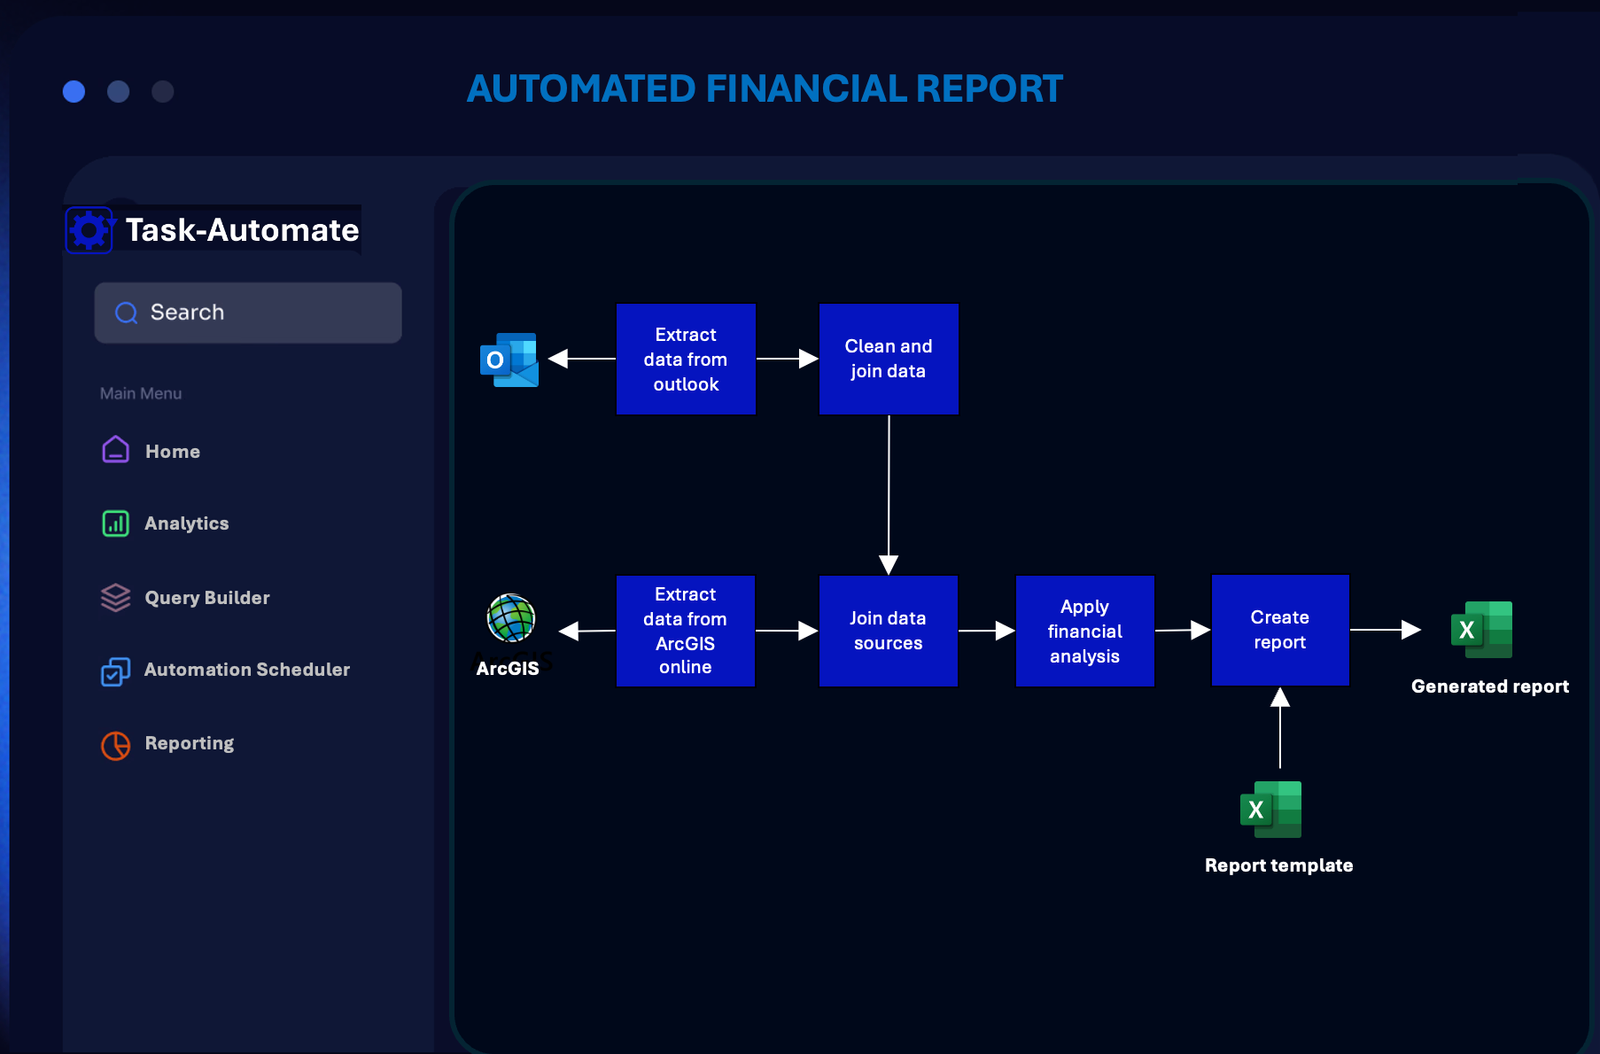
Basic: This automation workflow example automatically builds financial reports for a customer based on input data from Outlook and ArcGIS online, placing the finalised financial report in Sharepoint. The automation leverages Outlook an ArcGIS APIs to automatically collect data, each data source is cleaned and preprocessed before performing analysis. Analysis engine cross-references and processes the data, building the required financial report based on a template report. The automation frequency is set by the creator (e.g. daily/weekly cycle).
INFRASTRUCTURE GRAPHS
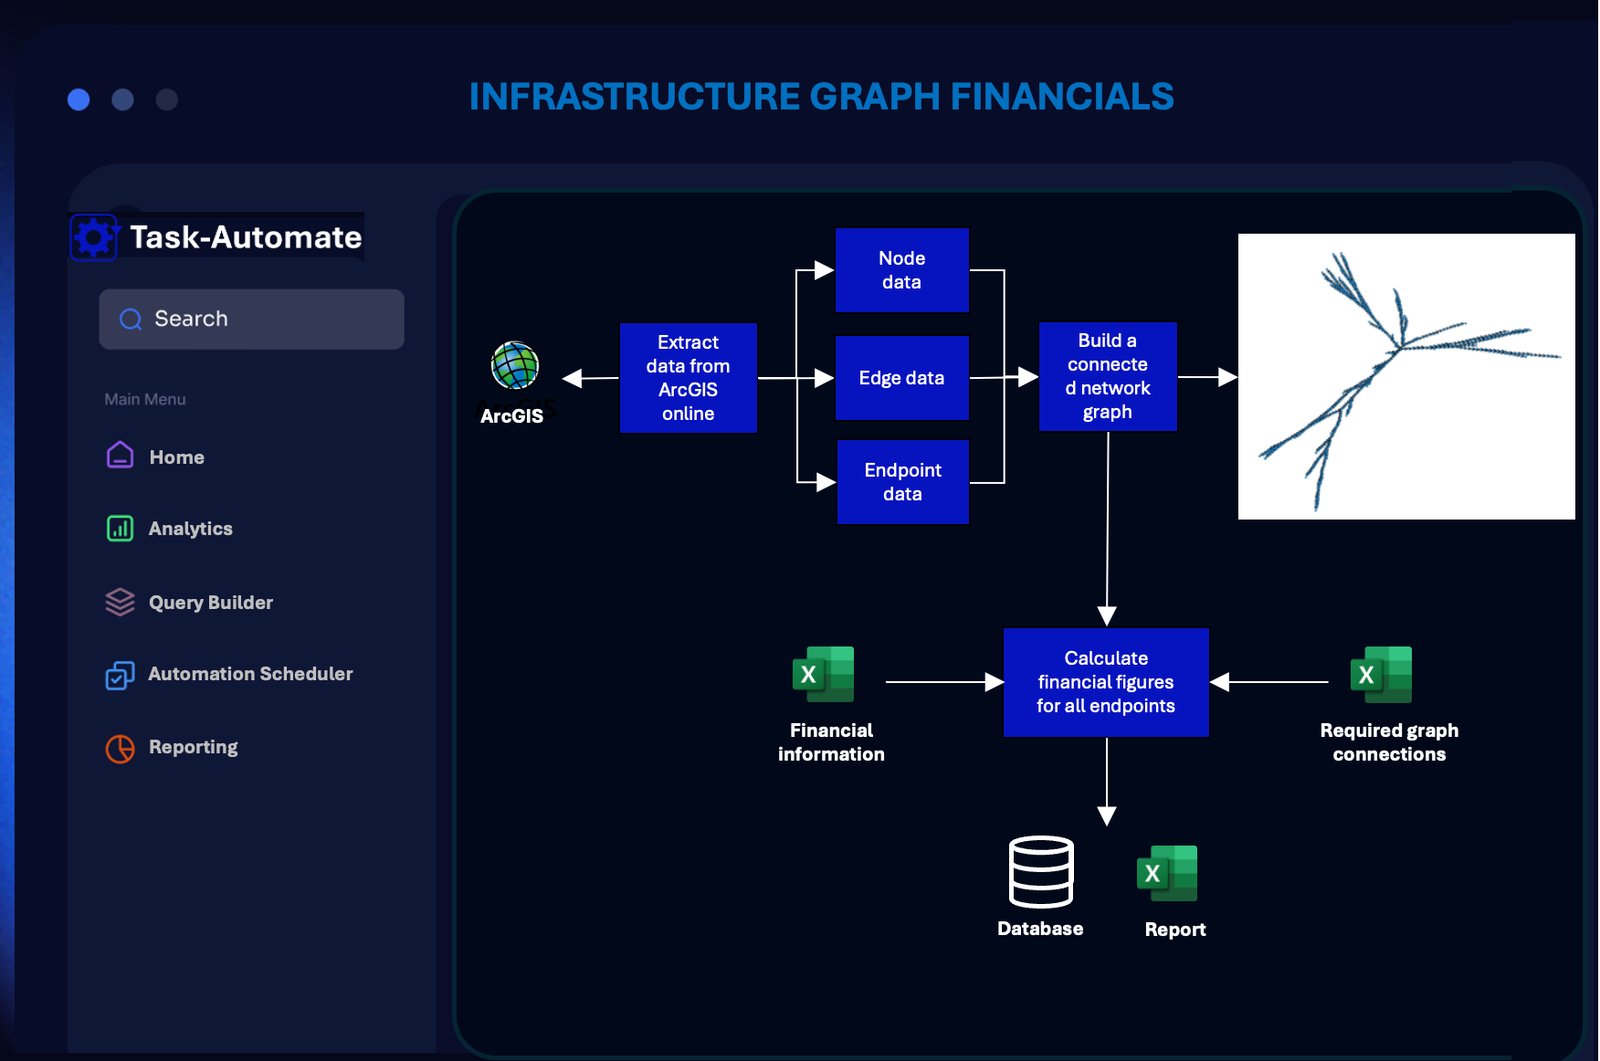
Intermediate: Understanding how a network is constructed is a crucial but non-trivial task. For instance in a fibre network we must understand what infrastructure is passed by each connected premises to streamline fault detection and ticket handing (i.e. grouping tickets based on infrastructural commonalities). Network graphs can also be used to understand the financial implications of extending or contracting networks based on the infrastructural changes required, allowing budget holders to make informed decisions on network infrastructure changes.
GEOLOCATION OF RADIO DATA
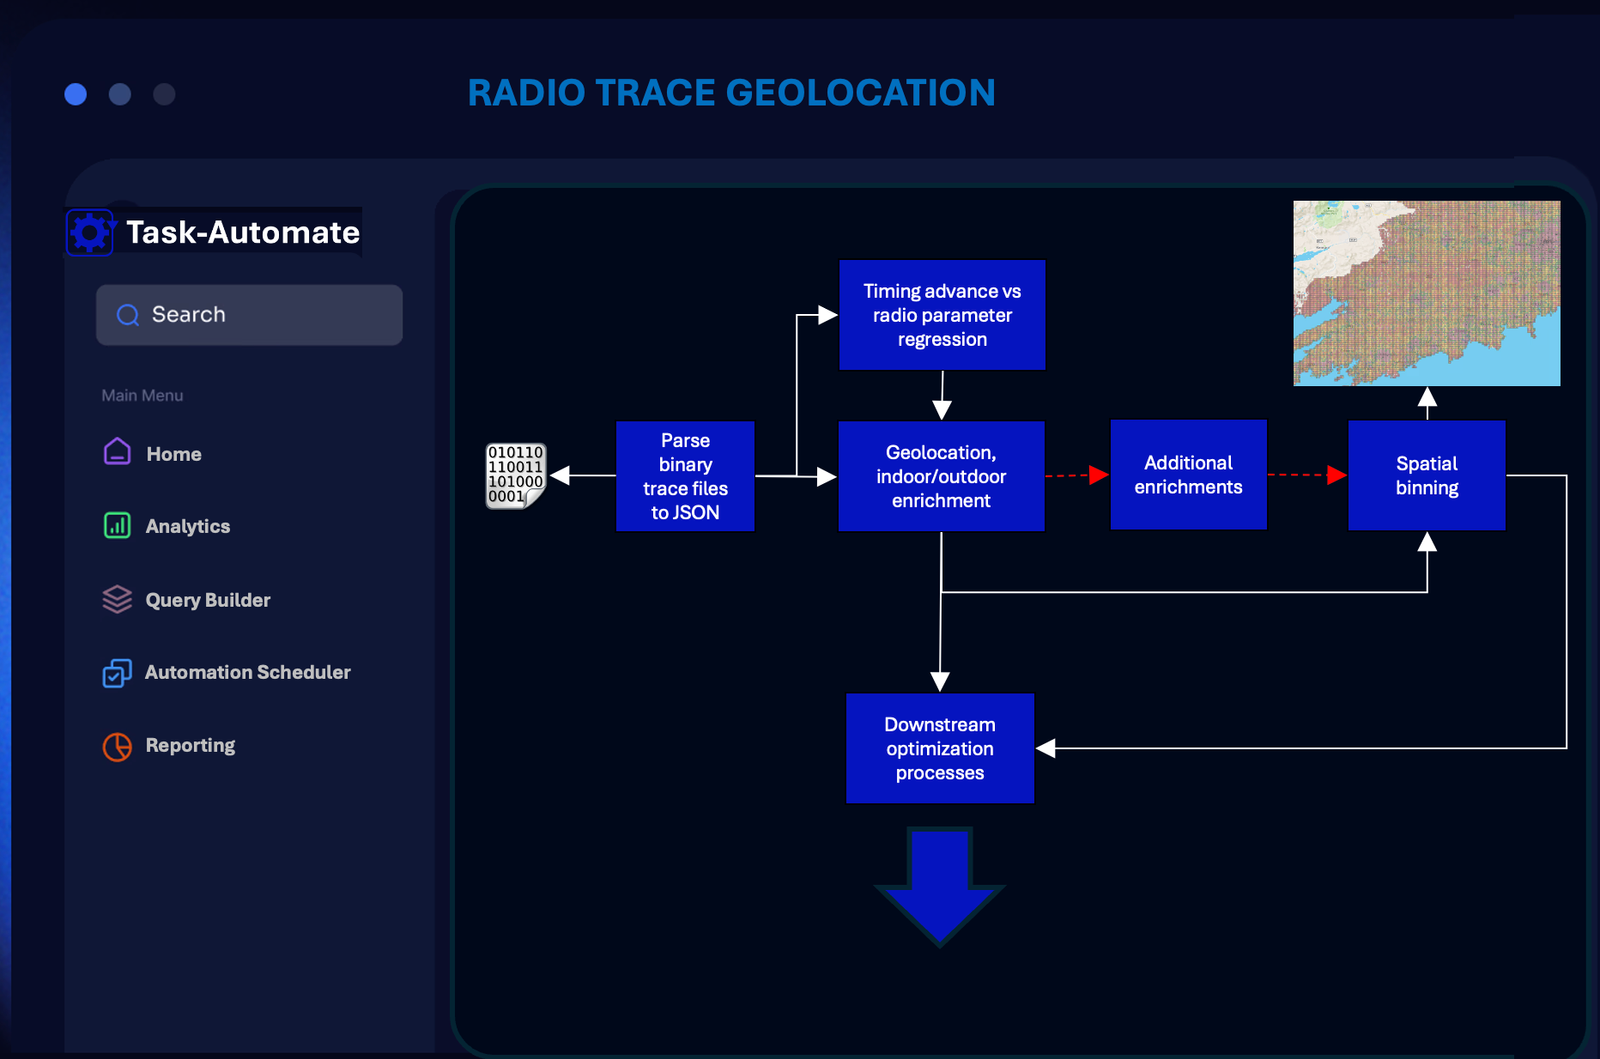
Advanced: Geolocation of Radio Access Network (RAN) trace data is an advanced automation workflow requiring a number of automation tasks including data parsing (binary to JSON), location enrichment (machine learning + geo-positioning), and data aggregation (spatial bins, transport infrastructure locations, etc.). Data aggregations can be used downstream by internal tools or to feed further automation workflows in the network planning and optimisation domains. Custom visualisation dashboards can be provided via cloud platforms (e.g. Tableaucloud).
Our Mission
“Our mission is to remove manual repetitive tasks from workflows to allow our clients focus resources on value activities to grow their businesses.”
Stephen Dillon, founder
Talk to us
Have any questions? We are always open to talk about your business, new projects, creative opportunities and how we can help you.